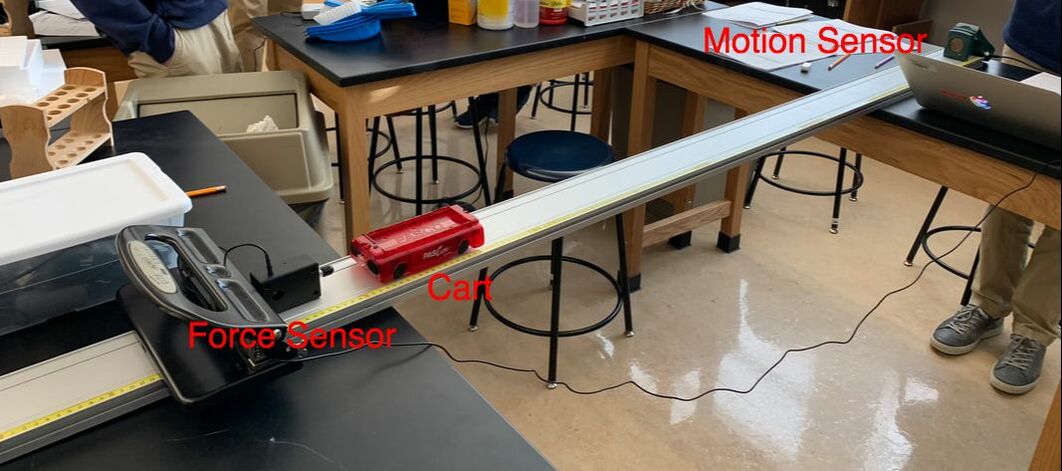
Our lab setup
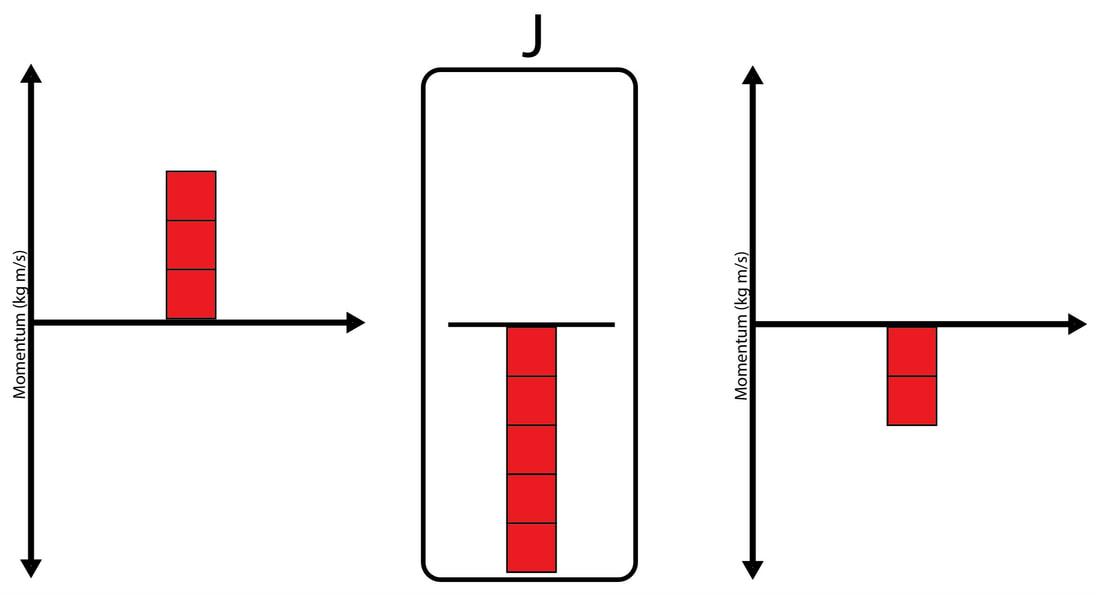
Momentum bar charts shows that initial momentum is positive but after a negative impulse the momentum has been changed to negative
Calculations
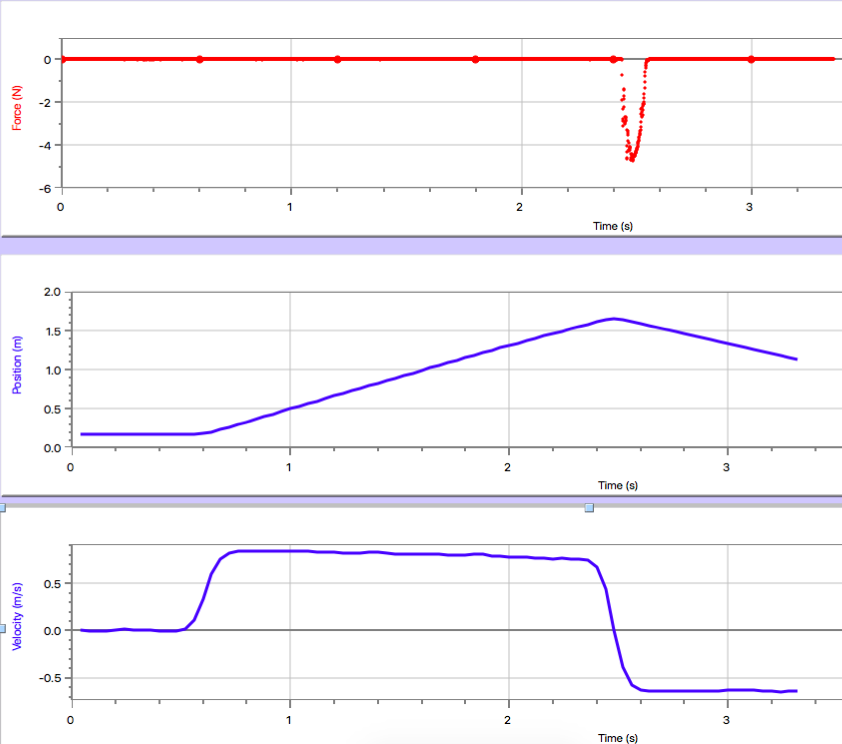
Initial Momentum = Velocity initial * Mass = 0.8 m/s * 0.252kg = 0.2016 kgm/s
Final Momentum = Final Velocity * Mass = -0.6 m/s * 0.252 kg = -0.1512 kgm/s
Impulse (change in momentum) = -0.1512 - 0.2016 = -0.3528 kgm/s
Impulse from Force vs. Time graph = Area under the graph = -0.3445 kgm/s
Percent Difference = |-0.3445+.3528|/.3528 = 2.35%
Final Momentum = Final Velocity * Mass = -0.6 m/s * 0.252 kg = -0.1512 kgm/s
Impulse (change in momentum) = -0.1512 - 0.2016 = -0.3528 kgm/s
Impulse from Force vs. Time graph = Area under the graph = -0.3445 kgm/s
Percent Difference = |-0.3445+.3528|/.3528 = 2.35%
Conclusion
This goal of this experiment was to show that impulse is just the change in momentum as well as the area under a force time graph. This was done with the lab setup seen above where a cart was pushed down a track, then hit a force sensor causing it to change directions and start traveling back. We observed the motion of the cart with a motion sensor and the force exerted with a force sensor and then made position time, velocity time, momentum time, and force time graphs. This allowed us to estimated the initial and final velocity which with the mass of the cart let us finds its initial final momentum, With this we were able to find the impulse. Because impulse is also area under a force time graph we were able to compare the two numbers we found and they were only 2.35% off from each other. Because this difference is so small we can conclude that impulse is the change in momentum as well as area under a force time graph.
This 2.35% difference could have come from multiple sources of uncertainty in the lab. One of these could have been friction. While the carts were made to have low friction there would still have to be a small amount which may have effected the data slightly as we didn't account for it. The data also could have been effected by inaccuracy in logger pro. While the force sensor had a very large polling rate as can be seen in the graph the points don't follow a perfect parabola like they should which could have skewed the area under that curve.
This 2.35% difference could have come from multiple sources of uncertainty in the lab. One of these could have been friction. While the carts were made to have low friction there would still have to be a small amount which may have effected the data slightly as we didn't account for it. The data also could have been effected by inaccuracy in logger pro. While the force sensor had a very large polling rate as can be seen in the graph the points don't follow a perfect parabola like they should which could have skewed the area under that curve.
Widget is loading comments...
