Lab Info
- Research question: How does the position of a motorized buggy change over time?
- Independent Variable
- Time traveled by the buggy
- Time traveled by the buggy
- Dependent Variable
- Distance traveled by buggy
- Distance traveled by buggy
- Control Variables
- Buggy used
- Camera position in Video analysis
- Buggy went in same direction
- Buggy used
Data Collection and procedure
We collected lab data in 3 different way. A stop watch, Motion sensor, and video analysis
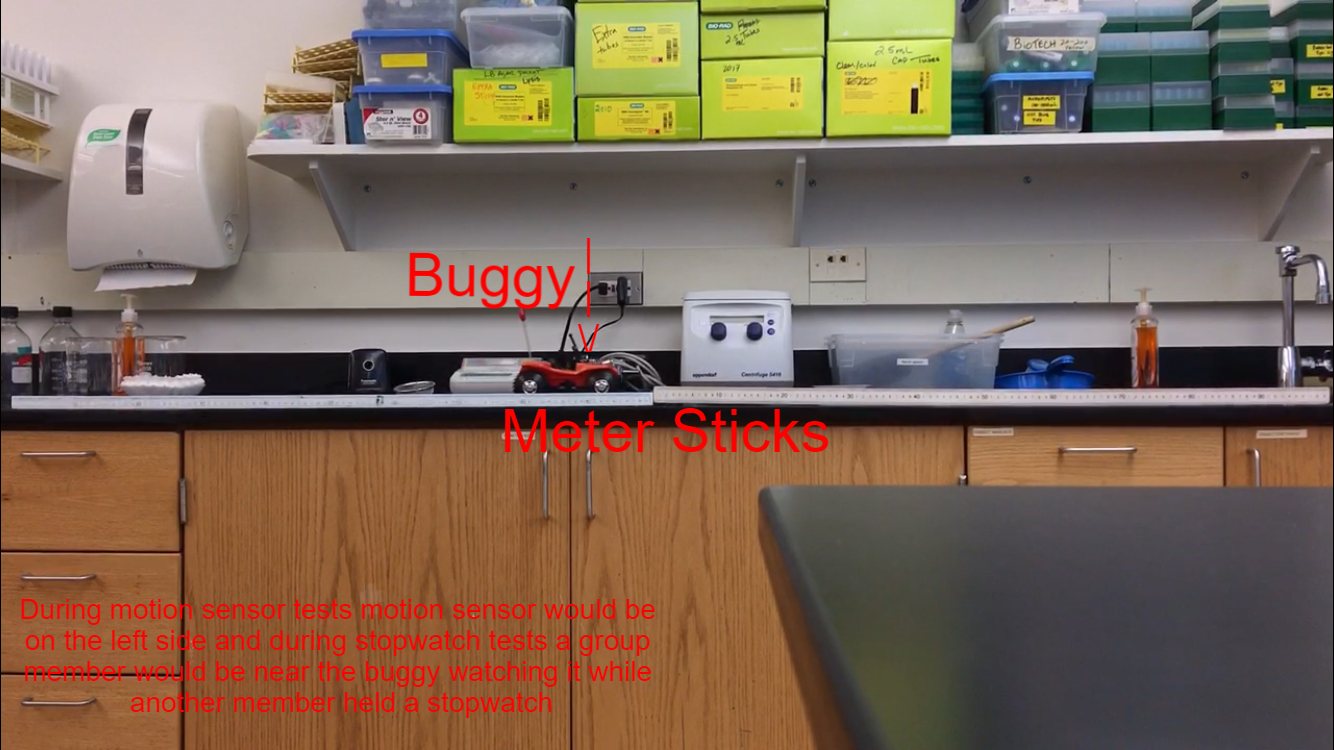
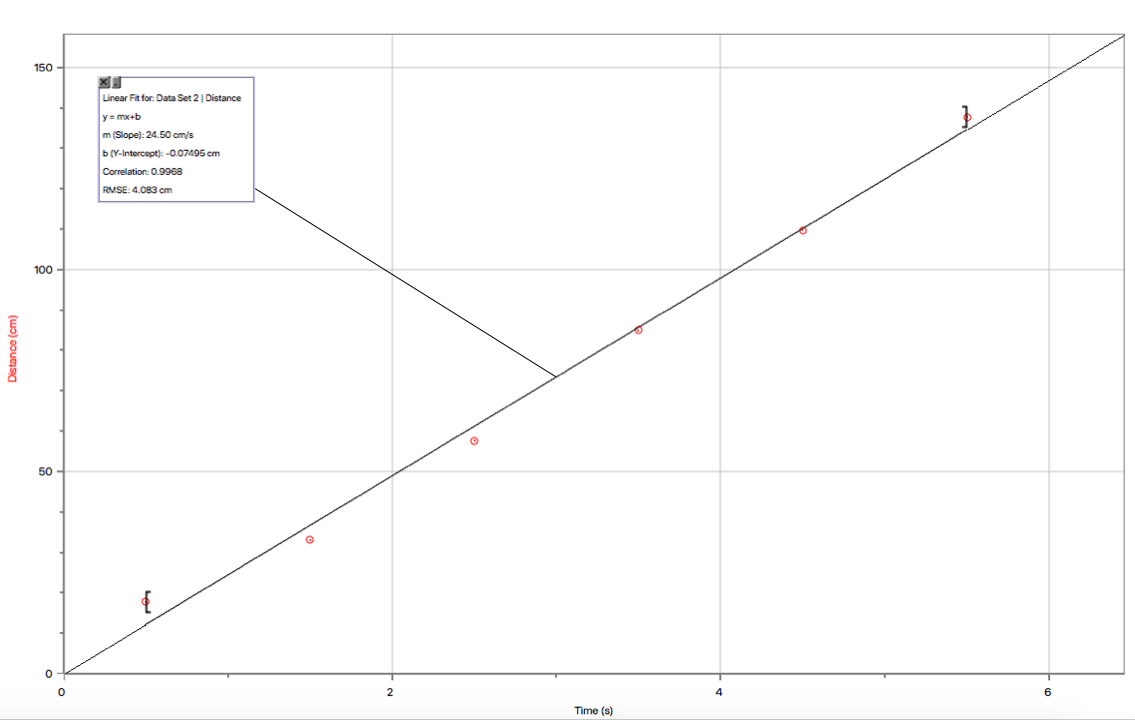
- For the stop watch we had one group member start the buggy, another start the timer when the front of the buggy reached the 0cm mark on the meter stick. The final group member then watched the location of the buggy until the member with the timer said stop meaning the given amount of time had passed (IV) and then recorded the distance the buggy traveled (DV). Time periods started at 0.5 seconds and went up by 1 second until 5.5 seconds was reached. 3 trials were done for each time period with this method
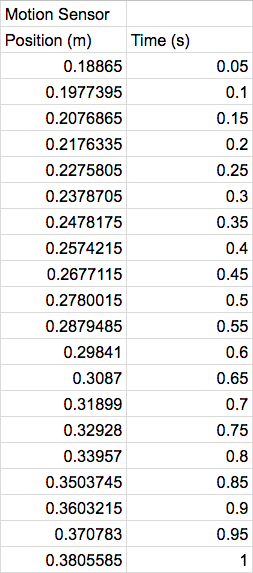
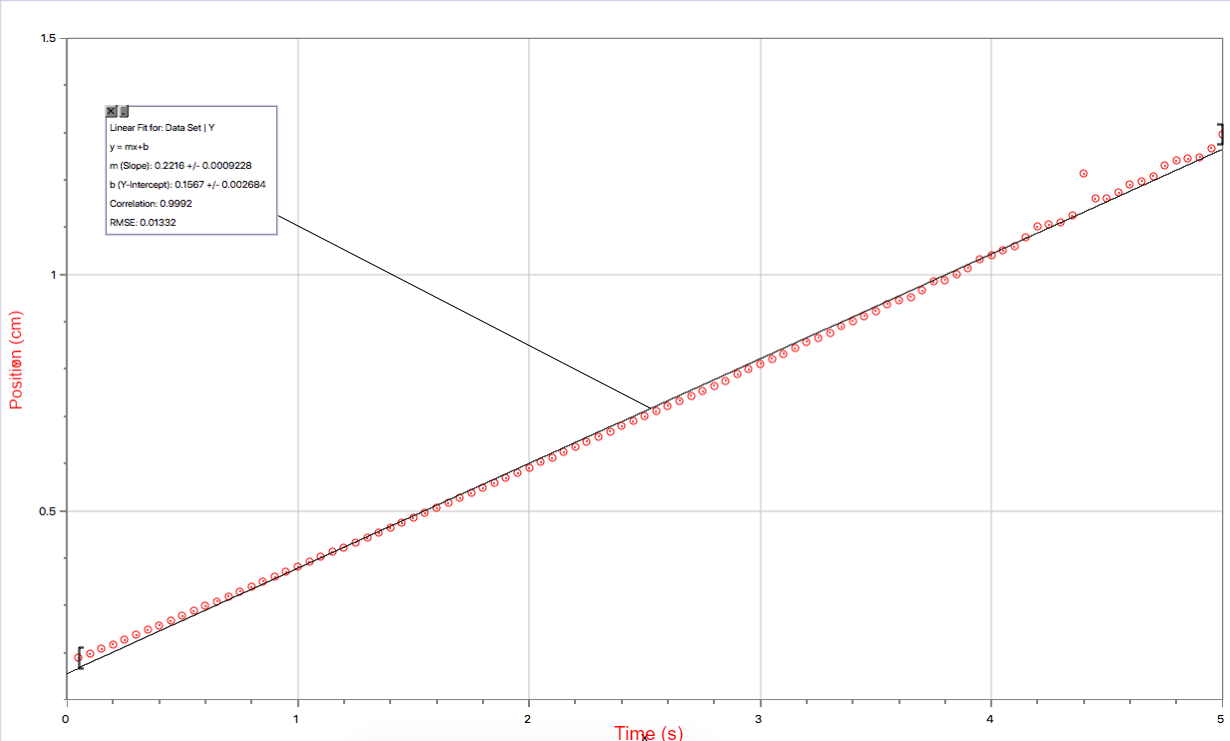
- With the motion sensor we connected the motion sensor to a laptop with logger pro. We then placed it 10cm behind the 0 cm mark on the meter stick as the sensor couldn't measure within 10cm of itself. The Buggy was then started along with the sensor which automatically generated a position(DV) time(IV) graph in logger pro.
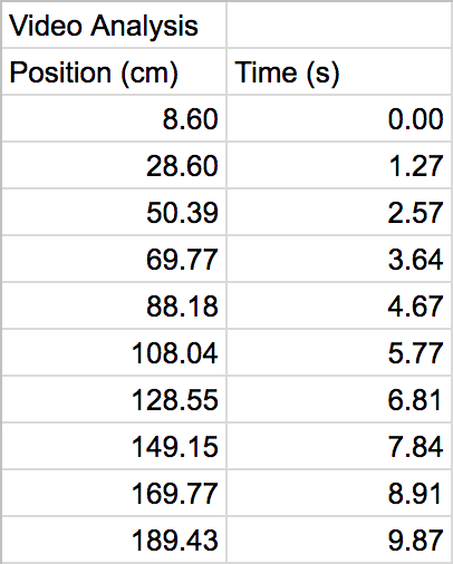
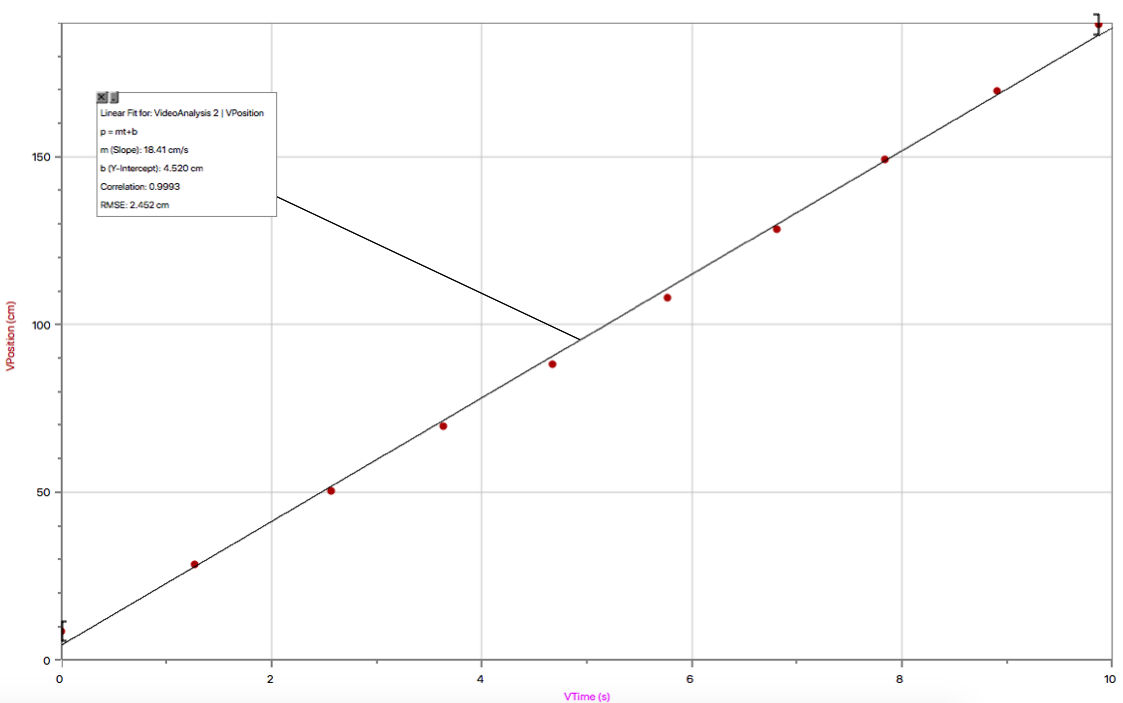
- For video analysis we recorded a video of the buggy driving parallel to the meter stick from a fixed point. We then imported the video into logger pro where we used its video analysis tool make data points plotting the buggy's position(DV) vs the time(IV).
Lab Diagram
Data
|
|
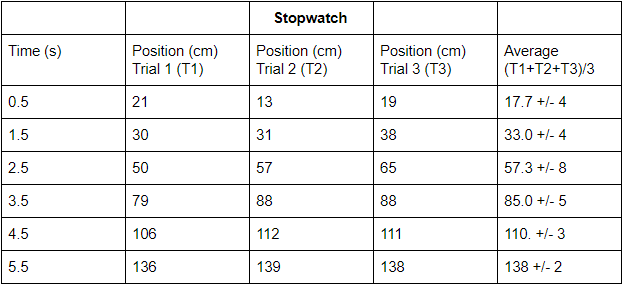
Uncertainty= (Largest position - Smallest position)/2 rounded to 1 sig fig
Was only used in Stopwatch as other data measurement had only one trial and much better accuracy
Was only used in Stopwatch as other data measurement had only one trial and much better accuracy
Processed Data
Motion Sensor Graph Position = 0.222m/s * Time +0.157m
Video Analysis Graph Position=18.4cm/s * Time +4.52cm
Stopwatch Graph Position = 24.5cm/s* Time - 0.0745cm
Conclusions
Through all the data we used linear fits as they fit the data well and the buggy travels at a constant velocity. But these 3 methods of data collection led to 3 different slopes or velocity for the buggy with the stopwatch saying it traveled at 24.5cm/s the video saying 18.4cm/s and the motion sensor saying .222m/s or 22.2cm/s. They all also have y intercepts that aren't 0 which shows some inaccuracy in the graph. They all should have started at position equal to 0 except for the motion sensor which could be accurate as we had to start it at least 10cm from the sensor. But even with all of this taken into account I believe that the velocity from the motion sensor is the most reliably due to the amount of data points it has to make the line of best fit. This line can also be adjusted to start at position equals zero by removing the y intercept as the slope/velocity is still accurate. So once all of this is taken into account the final relationship between time and position is position = 22.2cm/s.
Uncertainty could have been formed from multiple places. A large source of uncertainty for the stopwatch was the reaction speed of the person saying to stop as the time was reach and then the reaction time of the person recording the time. This couldn't be completely removed but more trials would have added to the accuracy of this data.
